Script Studio is part of the official MODkit for the Witcher 3, it allows for editing game scripts (though many modders prefer Notepad++), debugging scripts, profiling the game, as well as creating and installing mods.
Creating Mods with Script Studio[ | ]
Using Script Studio, you can create, edit, and install mods for the Witcher 3. You can create a mod by opening the File dialog, then selecting Create new mod. Enter in a name, a workspace (not inside the mod directory!), and the game directory, and Script Studio will create your workspace with a .redsln file, copy all of the vanilla game scripts to /scripts/source and create another folder /scripts/local where new mod files can be created.
Editing Scripts[ | ]
Script Studio can edit Witcher Script files with its built-in editor, which has:
- Syntax highlighting
- Folds between braces (collapsible sections)
- Parameter hints when calling a function
- Popup with function signature when hovering over a function name
- Decent search and replace with regex support
- Symbol browser (for finding classes/fields/functions)
Installing your Mod[ | ]
Once you've edited the files for your mod, you can go to File>Install Mod to install the mod to your game. This will check each file to see if you've edited it, then copy those files into the install directory for your mod.
Limitations[ | ]
Unfortunately, Script Studio has several limitations that make it extremely hard to use for modders. The biggest of these limitations is:
- Script Studio doesn't support having multiple mods installed.
This alone makes Script Studio near useless for most modders, who will have several mods installed, which is a shame, since it's a fairly good tool. You can still use the basic functionality of creating a mod, editing files, and installing, but all of the modding limitations apply. All of the advanced features won't work properly.
Connecting Script Studio to Witcher 3 Process[ | ]
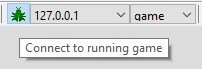
Connected to Game
You can connect to the game by launching the game with the flags -net -debugscrips. An easy way to do this is to create a shortcut to %GAMEFOLDER%\bin\x64\witcher3.exe, right clicking the shortcut, and entering the "Properties" menu. Add the flags at the end of the "Target" field so it looks something like (your path may be different):
Target: "D:\Games\The Witcher 3 Wild Hunt\bin\x64\witcher3.exe" -net -debugscripts
Launch Script Studio. It will try to connect to the REDkit 2 editor and, more annoyingly, will close menus and dropdowns every time that it tries again. Click the "bug" icon in the toolbar, it should turn red, that will stop it trying to connect, then use the dropdown with "editor" selected and select "game" instead. Click on the "bug" icon again, it should yellowish green, indicating that it is trying to connect, then a dark green when it connects to the game.
Recompiling Game Scripts[ | ]
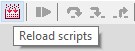
Recompile Button
With Script Studio connected to the game, you can trigger a recompile of game scripts at any time, this will freeze the game until it is complete, progress will be shown in the "Output" tab.
Line By Line Debugging[ | ]
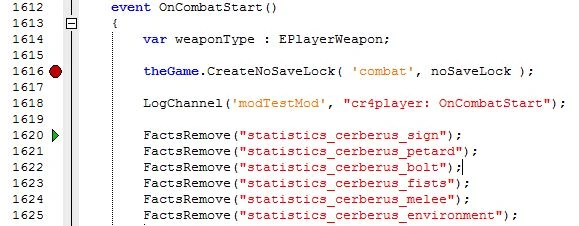
Line by line debugging
If a mod is installed using Script Studio, Script Studio is connected to the game, and that mod is the only mod installed (there may be workarounds for this), then you can set breakpoints in Script Studio by left clicking to the right of the line number or by using the F9 key to toggle the breakpoint on the current line. Once a breakpoint is reached, the game will pause, and Script Studio will now have a green arrow pointing to the current line which is currently the line that the breakpoint is on. Keep in mind that the currently selected line has not executed yet.
[ | ]
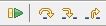
Navigation Buttons
- Continue (shortcut F5)
- Execute the current statement and exit line-by-line debugging, this will continue execution of the code where you left off and will not remove the breakpoint
- Step over current statement (shortcut F10)
- Execute the current line without stepping into any function calls and go to the next line.
- Step into statement (shortcut F11)
- Execute the current line and jump into any function that is called, this will open the file where this is contained and will continue debugging in that function
- Step out from current function (shortcut Shift-F11)
- Execute the current line and continue with the rest of the function, when that function ends, line-by-line debugging will continue in the function that called the current function.
Keep in mind that if a script was called by native code (the engine), then you cannot jump into that native code—once you've reached the point at which script execution has stopped and the game executes native code, then line-by-line debugging will stop and the game will resume and pause for you.
Information Available[ | ]

Additional Information
Additional information is available while in line-by-line debugging, available at the bottom of the Script Studio window in several tabs.
- Callstack
- This is the current function stack, each listing in this list is a function that has called the function above it, with the top listing being the current line.
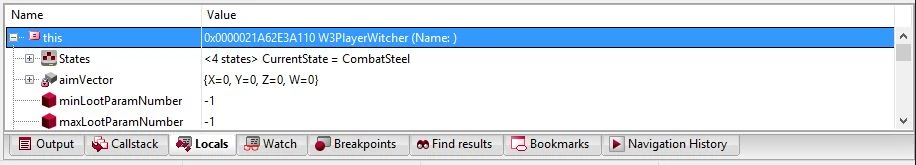
- Locals
- This is all of the local information available in the function that you are in. If the function is in a class, then all of the containing class information is listed under
this, which you can expand. For clases like W3Class CR4Player, the list of class members is very long. You can expand contained objects to see their members as well. - Watch
- You can assign variables to watch here. Double click to add a watched variable, type in the name, and hit enter. It should update to include the variable. You can assign variables from
thisto watch particular variables from the containing object. It doesn't appear that you can use global scoped variables likethePlayerthough. - Breakpoints
- This lists all breakpoints that you have set.
Profiling[ | ]

Profiling Buttons
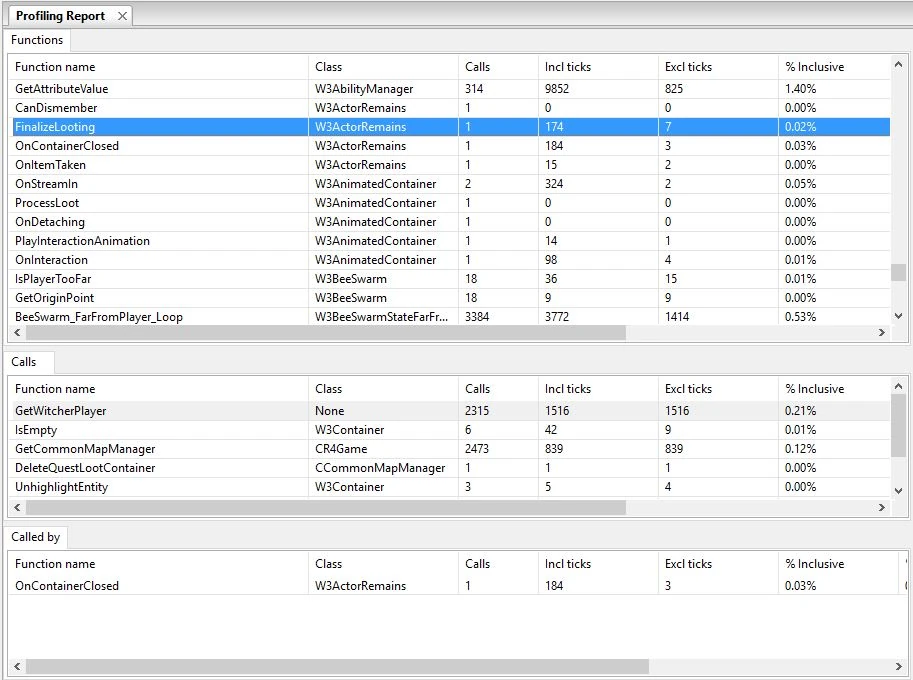
Sample Profiling Report
Script Studio can generate a report, either for the next x frames or continuously, about what functions are called, how many times they are called, how many ticks were spent in the function (this is a guess), and other information. You can click on functions to see what functions called that particular function and which functions that that particular function called.
This is particularly useful for checking for performance problems, especially if you have a function that is called every frame or every couple frames. It can also be useful for seeing exactly what is running at any given time and why it is running.